If you’ve ever wondered what’s actually moving on Amazon India, you’re not alone. With over 121 million products listed, the marketplace is a bustling digital bazaar — but not all categories are created equal.
📦 From fashion to electronics to niche hobbies, certain categories dominate in both volume and seller activity. For Indian entrepreneurs and D2C brands, knowing where the action is can mean the difference between an idle listing and a best-seller.
So we analyzed product and seller data across all Amazon India categories. Here's what we found 👇
🔍 A Bird’s-Eye View: India's Amazon Marketplace by the Numbers
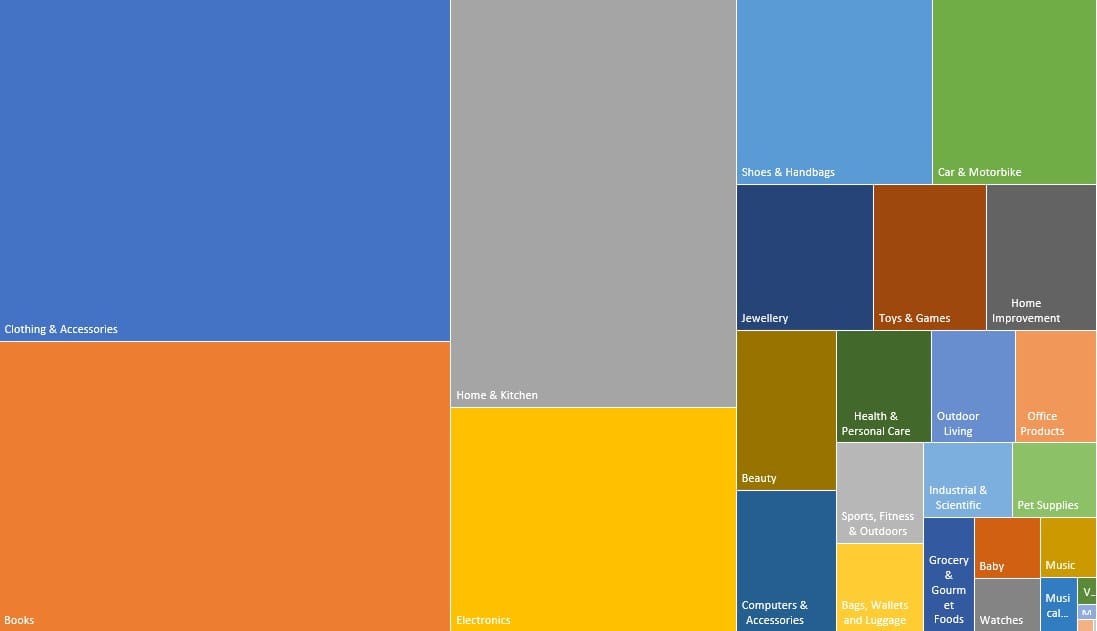
Amazon India hosts an astounding 121 million+ products. But the concentration is skewed — a handful of categories account for the lion’s share of listings, brands, and sellers.
Let’s break it down by top product-heavy categories:
| Category | Products | Brands | Sellers |
|---|---|---|---|
| Clothing & Accessories | 26,960,433 | 49,368 | 34,225 |
| Home & Kitchen | 20,312,940 | 110,039 | 67,427 |
| Books | 22,923,824 | 27,456 | 8,826 |
| Electronics | 11,189,896 | 27,955 | 15,332 |
| Jewellery | 3,489,943 | 14,189 | 10,513 |
These five alone represent over 70% of Amazon India's catalog. Clearly, sellers are flocking to these high-interest verticals — but not all with equal success.
🎯 Categories That Dominate (and Why)
🧥 1. Clothing & Accessories — India’s Amazon King
~27 million products, the highest of any category.
Dominated by unbranded and semi-branded sellers.
High volume, high churn — a great category for private labels or niche ethnic wear.
Despite saturation, sub-niches like maternity wear, yoga apparel, and Indo-Western fusion remain strong growth pockets.
Pro Tip: Check out this guide on Amazon seller models to choose between FBA, dropshipping, and hybrid strategies.
🏠 2. Home & Kitchen — India’s D2C Playground
110,000+ brands = the most competitive branding category.
Sub-segments like decor, storage, and home improvement tools are trending.
Huge opportunity in influencer-driven products (e.g., minimal organizers, boho rugs).
This category suits both artisanal brands and mass-market resellers, especially when coupled with storytelling.
📚 3. Books — The Hidden Giant
You might think books are passé, but India’s literary appetite says otherwise:
Over 22.9 million titles listed.
Surprisingly lean seller base (8,800+) = good margins for specialty sellers.
Popular niches: test prep, self-help, Indian authors, and regional language content.
Amazon’s Kindle ecosystem and self-publishing tools offer a lucrative entry point for content creators too.
💍 4. Jewellery — Low Weight, High Margin
With over 3.4 million SKUs, jewellery is booming — especially in silver, fashion, and minimal daily wear. What works:
High perceived value-to-cost ratio
Easily brandable + visual
Good for exports (low shipping cost, high ASP)
Dive deeper into how silver and handmade products are gaining popularity in this report
⚡ 5. Electronics — Competitive, But Rewarding
11+ million listings
High brand recognition plays a critical role
Buyer trust is essential — focus on reviews, A+ content, and warranties
Big opportunity for accessory brands (chargers, cables, cases) and white-labeled audio gear.
🧠 What's Driving Seller Growth in These Categories?
Key trends propelling these verticals:
1. Low Barriers to Entry
Clothing and kitchen products often need less than ₹1L in inventory.
Dropshipping-friendly categories make it easy for first-time sellers.
2. Demand Tailwinds
Work-from-home and hybrid lifestyle driving kitchen tools and athleisure sales.
Books and baby categories surged during COVID and retained their buyer base.
3. Branding Boom
D2C brands are winning on storytelling, packaging, and niche targeting.
Platform-native tools like Amazon Brand Registry and Sponsored Brands help boost visibility.
🚀 How Should Sellers Pick a Category?
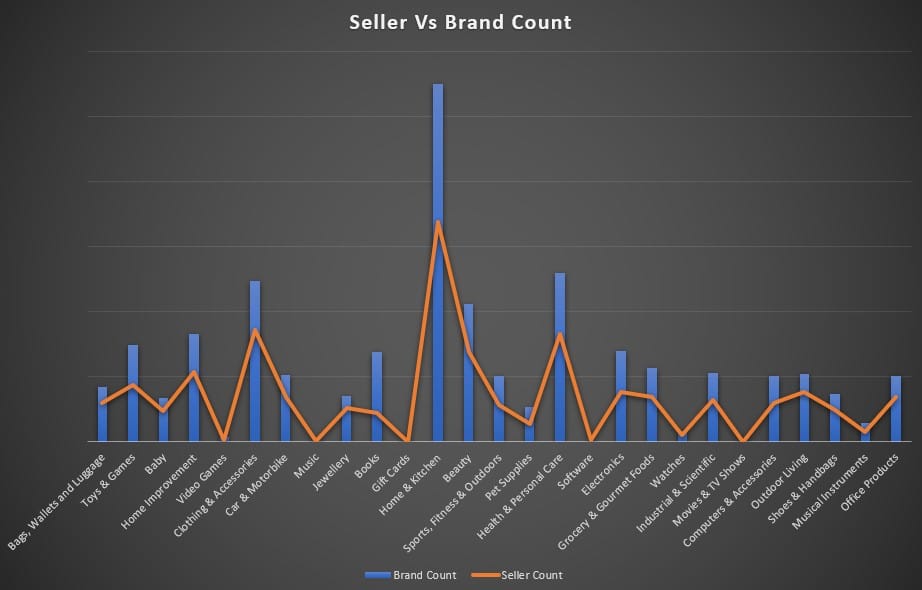
Seller vs Brand Count: What the Data Tells Us
1. High Sellers, Low Brands → Fragmented, Unbranded Markets
Categories like:
Clothing & Accessories (49,368 brands vs 34,225 sellers)
Home & Kitchen (110,039 brands vs 67,427 sellers)
Beauty (42,376 brands vs 27,702 sellers)
These categories show a high number of brands per seller — suggesting that:
Many sellers are pushing multiple brands (private labels or third-party portfolios).
There’s intense competition and saturation.
Branding is used heavily as a differentiator.
💡 Implication: These categories are noisy, so success often comes down to smart branding, strong visuals, reviews, and customer trust.
2. Low Sellers, Low Brands → Niche or Dominated by Aggregators
Examples:
Kindle Store (1 brand, 1 seller)
Audible Books & Originals (2 brands, 1 seller)
Alexa Skills (0 brands, 0 sellers shown)
These are likely platform-controlled or highly specialized categories, possibly reserved for:
Amazon-owned content ecosystems
A few authorized partners or B2B service creators
💡 Implication: Not open categories for general selling. Sellers looking to enter these must go via special programs or partnerships.
3. Moderate Sellers, High Brands → Private Label Paradise
Health & Personal Care: 51,980 brands vs 33,005 sellers
Pet Supplies: 10,619 brands vs 5,503 sellers
Grocery & Gourmet Foods: 22,544 brands vs 13,857 sellers
These categories suggest:
Sellers often launch multiple niche brands (e.g., Ayurvedic shampoo + pet food + supplements).
There's room to differentiate by targeting micro-segments and doing brand storytelling.
💡 Implication: If you have the ability to manufacture or source niche SKUs, these are attractive areas for multi-brand sellers.
4. High Sellers ≈ High Brands → Competitive but Fairly Balanced
Toys & Games: 29,752 brands vs 17,567 sellers
Electronics: 27,955 brands vs 15,332 sellers
Books: 27,456 brands vs 8,826 sellers
This trend often means:
These are established categories with a mix of brand manufacturers and resellers.
There’s brand diversity but not uncontrolled fragmentation.
💡 Implication: Sellers need to compete on listing quality, fulfillment speed, and customer support. Differentiation is harder unless you’re the original brand owner.
📌 Summary Inference
| Type | Characteristics | Suggested Strategy |
|---|---|---|
| High Brand, Low Seller | Aggregators or multi-brand players dominate | Private label and catalog expansion |
| High Seller, High Brand | Competitive, open categories with lots of brand options | SEO, A+ content, ads, product bundling |
| Low Seller, Low Brand | Niche or platform-owned verticals | Not viable for general sellers |
| High Seller, Low Brand | Reseller-heavy categories with low differentiation | Value pricing, speed, service quality |
If you’re just getting started or looking to expand:
✅ Look for:
High ASP (Average Selling Price) + low shipping weight
Medium competition (brands <30k, sellers <15k)
Search trend alignment (Google Trends + Amazon search data)
❌ Avoid:
Oversaturated categories unless you have deep pockets or strong differentiation
Extremely niche categories unless you're cross-listing internationally
🔄 Connecting the Dots: Category ≠ Success Alone
While Clothing & Accessories dominate listings, success depends on margin structure, reviews, ad strategy, and brand recall — not just volume.
Understanding your unit economics and investing in the right tools, partnerships, and positioning is critical.
For more on staying competitive, read this success blueprint for Indian Amazon sellers.
📌 Final Thoughts
The Indian Amazon landscape is massive, dynamic, and full of opportunities — but not without its pitfalls.
Sellers need to:
Pick categories strategically
Brand intentionally
Use data and feedback loops to scale smartly
With over 34,000 active sellers just in fashion and 110,000+ brands in home & kitchen, competition is fierce — but so are the rewards for those who play it right.